Features
Breeding
Genetics Week
Research
Technology
Analyzing genetics and environment for optimal performance
July 26, 2019 By Bas Wolkenfelt and Robbert Blonk
 Figure 1: Mean estimated breeding value (EBV) for harvest weight per family for region 11 and region 12) Performance of genetically improved stock of Atlantic salmon differs between regions in Chile
Performance of genetically improved stock of Atlantic salmon differs between regions in Chile, according to a data analysis of Hendrix Genetics’ breeding program.
Large differences were found in the ranking of families from the breeding program for the expected performance in Chile’s region 11 and region 12. This implies that for optimal performance in a specific region, specific families should be selected. However, selection of specific families requires that field performance for the genetic stock is collected in each region. By selecting stock based on performance data collected in region 12, an 804-gram improvement in harvest weight can be realized compared to the situation where selection is based on performance data collected in region 11.
Environmental traits
Following the large-scale outbreak of the infectious salmon anemia (ISA) virus between 2008 and 2010, stricter regulations for the Chilean salmon industry were created (Mardones et al., 2009; Niklitschek et al., 2013). These new regulations include expansion of the production surface area and the reduction of stocking densities (Alvial et al., 2012; Niklitschek et al., 2013). Together with the already limiting space in the Los Lagos region (region 10), these regulations have triggered salmon farmers to move southward to Aysén (region 11) and Magallanes (region 12) over the past years (Mardones et al., 2009; Iizuka and Zanlungo, 2016).
The environmental characteristics differ substantially between the salmon culture regions in Chile, with extreme changing photoperiod, and colder and less saline waters in the more southern areas (Ibieta et al., 2011; Niklitschek et al., 2013). In different genotype by environment (GxE) studies on salmonids, strong reranking of families was found between environments (Correa et al., 2018; Sae-Lim et al., 2013).
With future expansion most likely to take place in region 12, assessing genetic performance of Atlantic salmon in this region is of high importance for the efficiency of its salmon production (Alvial et al., 2012). The main question that we need to address, is whether a breeding program which is entirely based on performance recorded in region 11, is also effective for improving the performance in region 12. In the absence of genotype by environment interaction, the answer to this question would be “yes.”
In this study, we investigated the degree of genotype by environment interaction between region 11 and region 12 in Chile. This study was conducted based on sentinels from the Hendrix Genetics breeding program placed in these two regions.
Field intelligence
The breeding program run by Hendrix Genetics in Chile started in the late nineties, based on imported material from the Scottish Landcatch strain. The genetic strain underwent continuous genetic selection for the Chilean environmental and production conditions. For more than 15 years, the breeding nucleus is raised in high-biosecurity units, protected from environmental and sanitary risks.
The selection on the broodstock animals is based on family information from the field. An important source of field information comes from siblings raised in production environments (called “sentinels”). With this information, more accurate selection can be obtained for performance in commercial environments as these are notably different from the biosecure nucleus environment.
With the strategic move of the industry towards region 12, Hendrix Genetics also started to place sentinels in that environment to be able to respond to market needs going forward. To that end, relatives of families in the nucleus are marked, transported to production facilities at customer sites in various regions in Chile, and followed throughout the commercial production process. Typically, sentinels are raised under normal production circumstances including commercial densities, commercial diets, and sanitary treatments. At harvest, sentinels are followed through regular slaughter processing lines to obtain slaughter characteristics.
Data collection and analyses
For this study, full- and half-siblings of 48 families were tagged and sent to two sentinels, in region 11 and in region 12. By the end of the production cycle, the tagged fish were separated from the commercial fish and harvest information was collected. The harvest characteristics measured included: harvest weight, gutted weight, fillet weight, deformity, maturity, and fillet color.
Fixed effects for the genetic model were selected based on the general linear modelling procedure in R 3.5.1 (R Core Team, 2018). All potential interactions between fixed effects were tested and selected for the genetic model based on the condition of the p-value being < 0.05. Significant effects on harvest weight were found to be sex, deformity and maturity. Additionally, there was also a cage effect present for the sentinel group in region 11, where individuals were split up over two cages.
As phenotypes for each fish were available for only one of either locations, performances in the different regions were treated as different traits. Through phenotypic information of, and relatedness between (half-)siblings at the different locations, estimated breeding values and genetic parameters were obtained through the use of BLUP software of the BLUPF90 family (Misztal et al., 2002). For differences in production periods, feed and other management practices were corrected in the genetic analyses.
For harvest weight, the following genetic models were used:
yXI = m+ Sex+ Deformity + Maturity+ Cage +Animal + e
yXII = m+ Sex+ Deformity + Maturity+Animal + e
where yXI and yXII are the observations of harvest weight for individual animals in region 11 and region 12, respectively, and μ represents the population mean. The model includes fixed effects for sex, deformity, maturity, and in the case of region 11, an effect of cage, and is complemented by a random animal effect, and the random residual error e.
Genotype by environment was also investigated for fillet colour, deformity and maturity. GxE was estimated as the genetic correlation for the trait measured in the two different regions. In the animal model for estimating the genetic correlation for fillet colour the following fixed effects were included: sex, maturity and sea cage (for region 11 only). The fixed effects for both deformity and maturity were sex and sea cage (for region 11 only).
Figure 1: Mean estimated breeding value (EBV) for harvest weight per family for region 11 and region 12)
Results
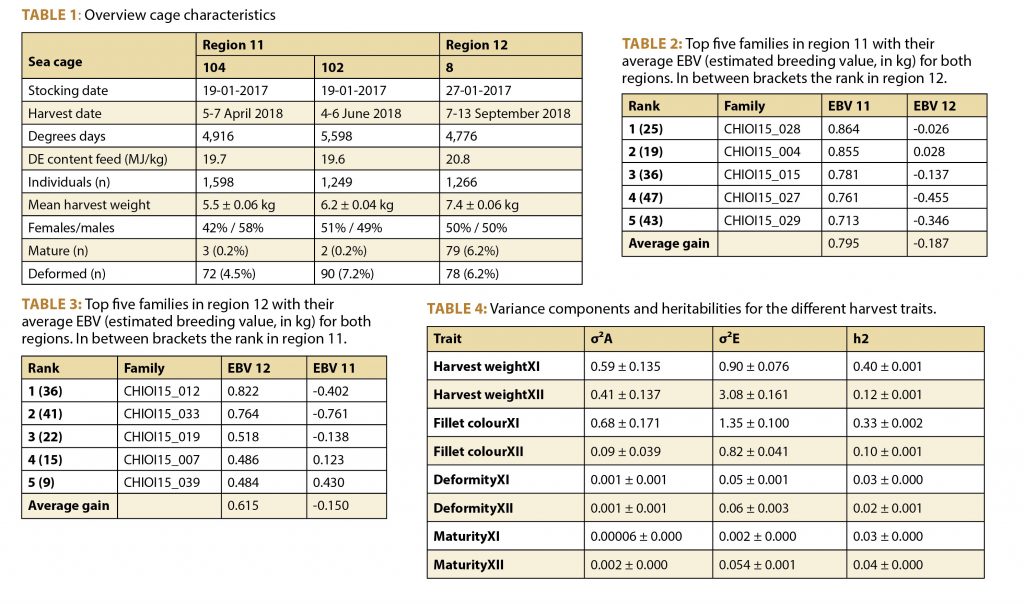
General characteristics of the harvest data for the three cages are summarized in Table 1.
Mean harvest weight in region 12 (7.4 kg) was significantly (p < 0.001) higher than in region 11 (5.5 kg and 6.2 kg), which is most likely caused by the difference in production period. Heritability estimates for harvest weight were found to be 0.40 ± 0.001 and 0.12 ± 0.002 for region 11 and 12, respectively.
The genetic correlation for harvest weight between the two different cages in region 11 was 0.93 ± 0.001. This suggests that, even with the difference in production period, there is hardly any genotype by environment interaction between cages in region 11, and therefore these cages were treated as the same environment.
However, between regions 11 and 12 the genetic correlation for harvest weight was -0.16 ± 0.006. This indicates a strong impact of the environment on the expression of genetic potential performance, resulting in a substantial re-ranking of families between both regions (Figure 1). Also, when using a more simplified model, excluding effects for deformity and maturity, the degree of genotype by environment interaction remained the same.
To illustrate the implications of these results, the top ten percent best-performing families in region 11 and in region 12 are displayed in Table 2 and Table 3, respectively. Based on these results, when selecting the ten percent best families in region 11, a genetic gain of 0.795 kg could be realized in that particular region. However, when stocking the exact same families in region 12, there will be a genetic loss of 0.187 kg. In contrast, when selecting for region 12 based on performance data from that specific region, there will be a 0.615 kg genetic gain. Adding this to the loss of 0.187 kg in case of selections based on performance data from region 11, a total gain of 804 grams could be realized if specific selections take place.
In addition to the harvest weight, strong genotype by environment interactions were found to be present for fillet colour, deformity and maturity with correlations of 0.57 ± 0.01, 0.57 ± 0.02, and 0.02 ± 0.002, respectively. The variance components and heritabilities for the investigated traits can be found in Table 4.
σ²A = genetic variance; σ²E = residual variance; h2 = heritability; XI = region 11 (Aysén); XII = region 12 (Magallanes).
Conclusions
The genetic correlations between traits measured in the two regions, indicate strong genotype by environment interactions for harvest traits of Atlantic salmon between the regions 11 and 12 in Chile. Particularly, the correlation of -0.16 ± 0.006 for harvest weight expresses a strong reranking of families between regions. Therefore, the best families in region 11 are different from the best families in region 12. This means, that for optimal salmon production in region 12, fish should be selected based on performance data specifically from region 12 and not from region 11. Similarly, fish destined for region 11 should be selected using data from region 11.
Based on the results of this study, selecting the ten percent best families for production in region 12, based on performance data collected in that same region, 804 g of genetic gain can be realized, compared to when data is collected in region 11. With a harvest size of 6 kg, this means an increase of approximately 14 percent.
Also, for the other harvest traits investigated, strong genotype by environment interactions were found. This result indicates the need for separate selections for the two regions. To optimize the selections of its breeding program, Hendrix Genetics currently has additional sentinel groups in different locations in Chile.
Bas Wolkenfelt is a geneticist at Hendrix Genetics in the Netherlands. Robbert Blonk is director of research and development at Hendrix Genetics Aquaculture.
Literature
- Alvial, A., J. Forster, J.M. Burgos, R. Ibarra, and S. St-Hilaire. 2012. The recovery of the Chilean salmon industry. ISA Cris. Its Consequences Lessons. Study Glob. Aquac. Alliance co-sponsored by World Bank, Undersecretariat Fish. Chil. Salmon Ind. Assoc. (SalmonChile). Puerto Montt, Chile.
- Correa, K., R. Figueroa, J. Yáñez, and J. P Lhorente. 2018. Genotype-environment interaction in Atlantic salmon body weight in fresh and seawater conditions. Page.
- Ibieta, P., V. Tapia, C. Venegas, M. Hausdorf, and H. Takle. 2011. Chilean salmon farming on the horizon of sustainability: review of the development of a highly intensive production, the ISA crisis and implemented actions to reconstruct a more sustainable aquaculture industry. InTech.
- Iizuka, M., and J.P. Zanlungo. 2016. Environmental collapse and institutional restructuring: The sanitary crisis in the Chilean salmon industry.
- Mardones, F.O., A.M. Perez, and T.E. Carpenter. 2009. Epidemiologic investigation of the re-emergence of infectious salmon anemia virus in Chile. Dis. Aquat. Organ.. doi:10.3354/dao02040.
- Misztal, I., S. Tsuruta, T. Strabel, T. Druet, and D. Lee. 2002. BLUPF90 and related programs (BGF90). Page in Proc. 7th World Congr. Genet. Appl. to Livest. Prod.
- Niklitschek, E.J., D. Soto, A. Lafon, C. Molinet, and P. Toledo. 2013. Southward expansion of the Chilean salmon industry in the Patagonian Fjords: Main environmental challenges. Rev. Aquac.. doi:10.1111/raq.12012.
- R Core Team. 2018. R: A language and environment for statistical computing. Vienna R Foudation Stat. Comput.. doi:10.1007/978-3-540-74686-7.
- Sae-Lim, P., A. Kause, H.A. Mulder, K.E. Martin, A.J. Barfoot, J.E. Parsons, J. Davidson, I.I.I. Rexroad C. E., J.A.M. van Arendonk, and H. Komen. 2013. Genotype-by-environment interaction of growth traits in rainbow trout (Oncorhynchus mykiss): A continental scale study1. J. Anim. Sci. 91:5572–5581.
Print this page
Advertisement
- Investigating low salinity in rearing spotted seatrout
- Oyster breeding project seen transformative for Eastern Canada